 30 YR BONDS
The bond complex had a nice reversal Thursday, leading to a nice upside week.
The 50% retracement level did give way as expected, however, it was short lived. Notice that the
channel gave near perfect support.
There are several layers of resistance directly overhead. This includes the 50 sma, the broken base
channel, and the small down
channel.
One possibility is that structure may be tracing a small triangle here, with the Thursday low of 117-10 being the
[b] leg.
If that's the case, this would suggest a zigzag, which means this would likely be an
X wave. Any trade through the 120-15 H or 117-10 L would invalidate this view.
Of course, we have to watch for a flat as well.
Bottom line - If a little triangle scenario is play, we are likely range bound in this market for the next couple of weeks.
Price basis combined contract.
 CRUDE
CRUDEThe crude market corrective continues. We have now registered 17 trading day's in a sideways market.
Although this chop has been difficult to discern from a pattern standpoint, it has been very tradable with plenty of range.
I show a simple
(a)(b)(c) , though it's possible we are tracing a combination.
We have broken free of the 20 sma and appear headed for a meeting with the 50 sma, which is at 74.57 and rising.

This is one way of looking at the intraday structure.
If part of a combination, or
(w)(x)(y), then we should be finishing up a sub-minuette
c with the completion of an upcoming
[5] wave.
If we are getting ready to finish a
iii wave, then
[5] will need to make a decent move down, as the price extreme of i is 76.71.
I suspect this is an
abc that ends a
(y) wave.
Bottom line - near-term it appears that we should see at least one more leg down. We can reassess at that point.
All prices basis continuous contract.
 DOLLAR INDEX
New lows for the dollar this past week.
I have changed the labels to better align with the continuous contract. The continuous clearly shows a
4th wave triangle, while the combined would be considered a "cheater."
It appears that we had 5 waves down off of the spike high of 77.50. If it is a
minute degree, structure would be complete. Any degree less, argues for a 1st wave.
Confirmation of a change in trend will come from:
1. a clean
channel break
2. closing of price above the 50 sma
3. RSI break of the 50% level
4. a 5 wave move higher (impulse)
5. completed downside structure
Until the above 5 take place - I will assume the dollar continues lower.
Price basis combined contract.
 GOLD
GOLDThe gold market continues to subdivide higher, reaching new highs in the process.
It's apparent that we are getting very close to this leg finishing. I am assuming that this will complete a minute degree wave
[v] coming out of the triangle. Remember that triangles precede finishing moves.
If this interpretation is correct, we will complete an intermediate degree
(B) wave at this moves conclusion.
As posted in previous updates, my alternate view is that there was no triangle, but a series of 1's and 2's. This means we would be in minor
3 of intermediate
(3) up.
I am anxious to see what type of price action we get when this leg finishes subdividing. Whatever it completes should be tradable.
Sentiment continues to maintain over 90% bulls according to the
DSI readings.
Bottom line - We keep going up until we don't. If I were long, and I'm not, I would use Friday's low as a stop and perhaps trail it up.


 ES
ES The 15 minute pit session chart shows an island reversal. This is basically an exhaustion gap that is followed by a breakaway gap in the opposite direction.
 It appears that we have 5 small waves up from the 1085.25 L, which I have labeled as a sub-minuette degree a or i.
 Any trade through the 1085.25 L would invalidate this view.

 CORN
CORN SOYBEANS
 WHEAT
WHEAT Price action played out exactly as expected today.
 Wave [4]appears that it will take on the form of either a triangle or a flat. The (A) wave clearly looks like a double zigzag to me, which is considered a 3.
 Crude spent the better part of the morning in some sinister chop fest of a complex corrective before breaking down. Not unexpected price action.
 This is an intraday look at the back half of what I believe was an [W][X][Y] expanded flat.
 Crude basically played out as expected today.
 I wanted to update the price action in the grain markets.
 The corn market has had impulsive price action as well.
 I also wanted to bring your attention to the gold market.
 The 75.57 L obviously finished something.
 30 YR BONDS
 CRUDE
CRUDE This is one way of looking at the intraday structure.
 DOLLAR INDEX
 GOLD
GOLD CORN
CORN SOYBEANS
 WHEAT
WHEAT Was today an important date?
 Well, obviously the triangle didn't work as price traded through the 76.71 L.
 What the hell pattern is crude in? I'm not real sure folks, but here is a wag.
 ES
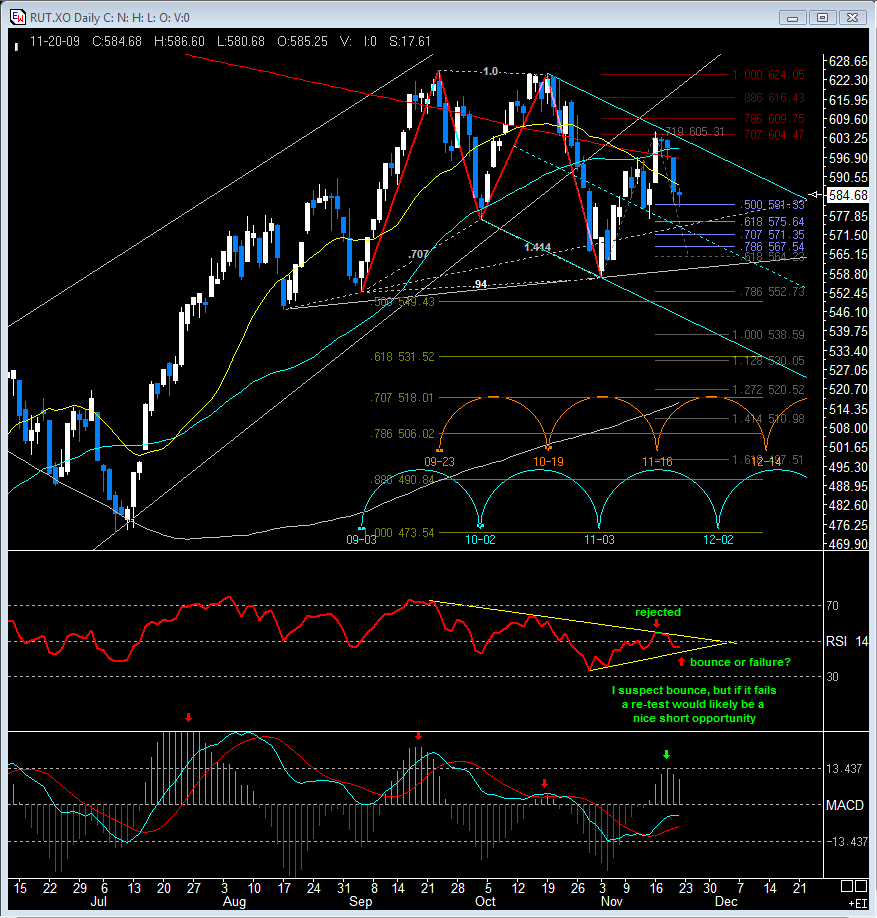
ES November 16 is a date that has my interest.
 30 YR BONDS
 CRUDE OIL
 DOLLAR INDEX
 GOLD
GOLD


