
 Posts
Posts


++7_15_2010.jpg)
Showing posts with label ES. Show all posts
Showing posts with label ES. Show all posts
Thursday, July 15, 2010


Friday, July 9, 2010
++7_9_2010.jpg)
Thursday, June 24, 2010
ES
++6_24_2010-2.jpg)
The question was not IF we get down to the 1067 area WILL it support, but rather, will there be a change in trend WHEN we get there? If structure needs additional downside, we would assume that it would continue to work off the golden triangle. That means we would look for the 190.2 expansion of the XA leg @ 1053.25, or the 3.618 projection @ 1022. The 3.618 expansion is down at the 1008.25 level.
Notice how many times the .526 and 1.902 has led to pivots on the way down thus far. Pretty amazing huh? This begs the question, could this unfolding geometry just randomly occur by chance? Just remember...all waves of similar degree will relate by both PRICE and TIME.
++6_24_2010.jpg)
++6_24_2010.jpg)
Tuesday, June 22, 2010
++6_22_2010.jpg)
Friday, June 18, 2010
++6_18_2010.jpg)
Thursday, June 17, 2010
++6_17_2010.jpg)
Monday, June 14, 2010
++6_14_2010.jpg)
Sunday, June 13, 2010
++6_11_2010.jpg)
Friday, February 12, 2010

Sunday, February 7, 2010

Wednesday, January 27, 2010


Saturday, December 19, 2009


Saturday, November 21, 2009
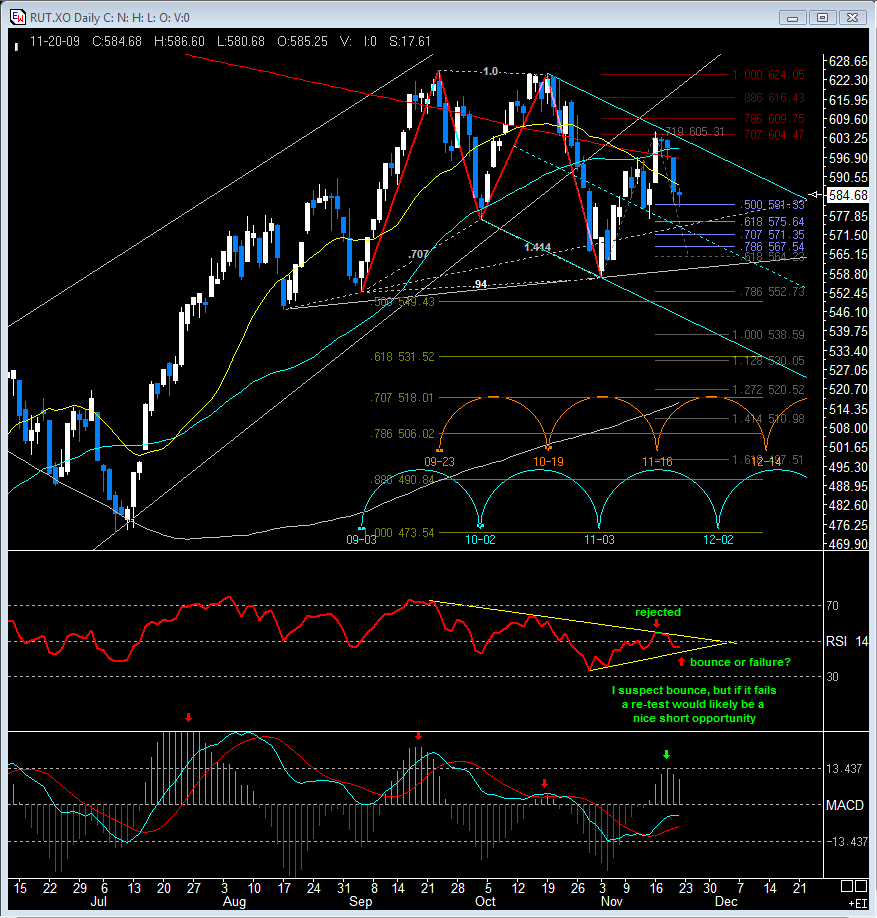
Weekend Update - ES, DOW, RUT, Nasdaq
 ES
ESThe overall pattern for the ES, and all the equity markets for that matter, remain difficult to discern.
It's just one of those situations where we won't truly know what structure has traced until after the fact, which is not uncommon.
It makes it hard for position traders, and to some extent, swing traders. If your a scalper like me, you should be doing just fine because all we really care about is where the next 3-6 handles is headed.
 The 15 minute pit session chart shows an island reversal. This is basically an exhaustion gap that is followed by a breakaway gap in the opposite direction.
I am counting the move off the 1112.25 H as a 5 wave structure. You could argue for a 3, but I think it counts best as a 5.
This implies that after a retrace process we should see an additional 5 waves down, at minimum.
 It appears that we have 5 small waves up from the 1085.25 L, which I have labeled as a sub-minuette degree a or i.
Drilling down further, we can see that it appears that micro [A] is complete. We should get a small [B] retracement (levels on chart) when globex opens, followed by a [C] leg lower.
At that point, I would expect to see a 5 wave structure higher of sub-minuette degree. If your a scalper, it should make for a nice little trade, as a measures 7.5 handles.
 Any trade through the 1085.25 L would invalidate this view.
The weekly view suggests that we should see additional downside pressure on price.
This past week saw price action fill the long standing gap from October 08.
More noteworthy, in my opinion, is that we had a KoolsTools cycle peak come due. This suggests that we may see lower price, though never a certainty.
This basically jives with what short-term structure is suggesting as well.


Sunday, November 15, 2009


Sunday, November 8, 2009
Weekend Update - ES
 ES
ESI don't have time for writeup.
I have taken this near-term view, which is spelled out on the Renko chart.
Sure looks like a clear triangle to me, which suggests a (c) leg higher to finish [ii], or a B wave.
 November 16 is a date that has my interest.
Thursday, November 5, 2009
ES
 As expected, structure played out exactly as was suggested last night.
Wave (b) was indeed complete at the 1041.50 L, right at the 50% retracement level.
Wave (c) appears to be tracing a diagonal triangle here. This suggests that (c) has finished its first 4 waves, with this being v of (c).
If this is correct, then (c) will never make it to equality. The 78.6% projection of (a) is at 1066.25. The minimum objective of 61.8% of (a) was met at 1061.
 We have retraced a satisfactory amount of minute [i], as the 50% level was met at 1062.25.
I'm not real thrilled about this potential triangle development. I would much prefer a retracement process that took us to at least the 70.7% level.
There are alternatives. Perhaps this is a double zigzag combination and this is a b wave, with a nice c to follow.
There is also the possibility that if price and/or time has not been sufficient, then we would trace an (x) wave after completion of (c).
Just take it one wave at a time.
Wednesday, November 4, 2009
ES
 Quick take on my view of ES.
My guess is that minute [ii] has not completed as of yet.
I show the 1057.50 H as finishing minuette (a). Wave (b) looks to have traced an expanding flat. If this is correct, (c) up should follow.
If (b) has completed, which is not clear, upside targets are the blue fib set. Equality comes in at 1073.
The retracement levels of [i] are on the chart.
I was anxious to see how price would react to the meeting of the channels. Not surprisingly, they decided to gap it over, instead of the hand to hand combat alternative.
It should be noted that [ii] may very well have finished at the 1058.50 H, where I have b. The minimum requirements are met at that level. This is not my view, but it is certainly possible.
Bottom line - I am expecting (b) to finish up in short order, if not already. From there, we should see 5 sub-minuette degree waves up to complete (c), and thus [ii].
Scalpers like me, should find this leg up very tradable.
Thursday, October 29, 2009
ES
 The equity markets had a strong rebound day. ES Range was 26.75 handles, while volume contracted. Noticeably lagging was the Naz.
There are a few ways to look at structure, this is one view. There is no reason to bring up the other options I'm looking at until needed (which may be soon).
I have labeled the 1038 L (pit session) as minuette wave (iii), as this makes the most sense at this time. This leaves us tracing (iv) currently.
It appears to me that we have a zigzag type move off the 1038 L. I believe it counts best as a double zigzag, but you could argue for just a single. I DO NOT think it supports an impulse very well, though it's certainly possible.
Where will I know this view is incorrect? Any trade through the 1070.25 level, as this is the price extreme of (i).
Notice that price was stopped precisely at the channel line. This channel is just a guide until the wave (iv) price extreme is in place. At that point, we would connect (ii) and (iv).
One of the issues I have with this interpretation is the lack of alternation in (ii) and (iv) thus far. Remember, that's just a guideline and not a rule, however, I always like to see it.
Perhaps (ii) is in the wrong place. Maybe it finished at the 1088.50 H? This would take care of the alternation concern and leave us with a beautiful in-tact channel.
We will need additional price action to fully understand what's going on. At this point, we are trying to make educated guesses. Sometimes structure gives you enough hints and clues that allow you to have a fairly good idea, while other times your left wondering what exactly the hell is going on.
I'm somewhat satisfied with my view so far. I would like to see price action hold the channel, though not necessary, and trade to the downside tomorrow. It would be nice to take the big gap back, however, a truncated wave (v) would be fine.
Wednesday, October 28, 2009
ES
 The equity markets experienced hard downside price action. Range on the ES was 25 handles, while volume was very heavy and expanding.
Volume has continued to expand during this sell off, suggesting that distribution has been taking place.
This is what structure looks like intraday. This is the same chart posted in eChat, except I have added the fib relationships.
It is unclear what that mess is in the middle with the question mark. I believe it is probably a triangle and looks much better when not scrunched up. This suggests a B or 4th wave.
The question is what degree - if a 4th. It is possible that it is sub-minuette degree, which means that we are finishing up wave v, and thus minuette (iii). I don't really care for the fib relationship, but it is what it is. We should know shortly.
It is very possible that the degree's should be moved up a notch.
 The weekly chart shows the nice rejection price had with the upper channel line. In fact, there were several lines of interest in the same vicinity, though not all are shown.
Notice the action in RSI. It has broken its uptrend line from the March lows. There is also negative divergence in place.
MACD has a cross-over that occurred several weeks back. Notice that it has tried to retake the average, but has failed, resulting in a bearish hook. The histogram has been divergent for months.
The channel off the March lows has been violated. Should price close below this channel, this would be confirming evidence that, at minimum, an intermediate degree correction is at hand - and possibly the end of the bear rally.
 Cash has broken and closed below the uptrend channel off the March lows. This is a big deal folks.
I believe this is telling us that this intermediate degree ABC (or WXY) has completed. This means that we are in the process of tracing a (1) down, if that also completed a primary degree [2] wave, thus ending the bear rally.
Should primary [2] need additional work, then we would be tracing an (X) wave instead.
In each case, it portends much lower price. I have placed prices of the pivots that may provide support on the chart.
In my update on October 18th, I stated that I felt a man-sized correction was very near and that it wouldn't surprise me if it was 100 handles or better. Any intermediate degree decline should easily achieve that.
The next major KoolsTools cycle low comes from the 9/23 and 10/21 dates. This should arrive in 16 more trading days. There is also a peak scheduled in 4 trading days.
Edit: I failed to mention what bullish alternatives could possibly be in play. The only viable option that I can see, is that the 1099 H finished a 1st wave of an ending diagonal.
I believe that this is low probability. Any trade through the 1012 (1015 pit session) level invalidates this option. In my opinion, the best bullish case is that we are tracing an (X) wave. Sorry bulltards - now assume the position!
Subscribe to:
Posts (Atom)


